
Home Sales, Prices & Trends in Indianola & Suquamish December 2010 through June 2012
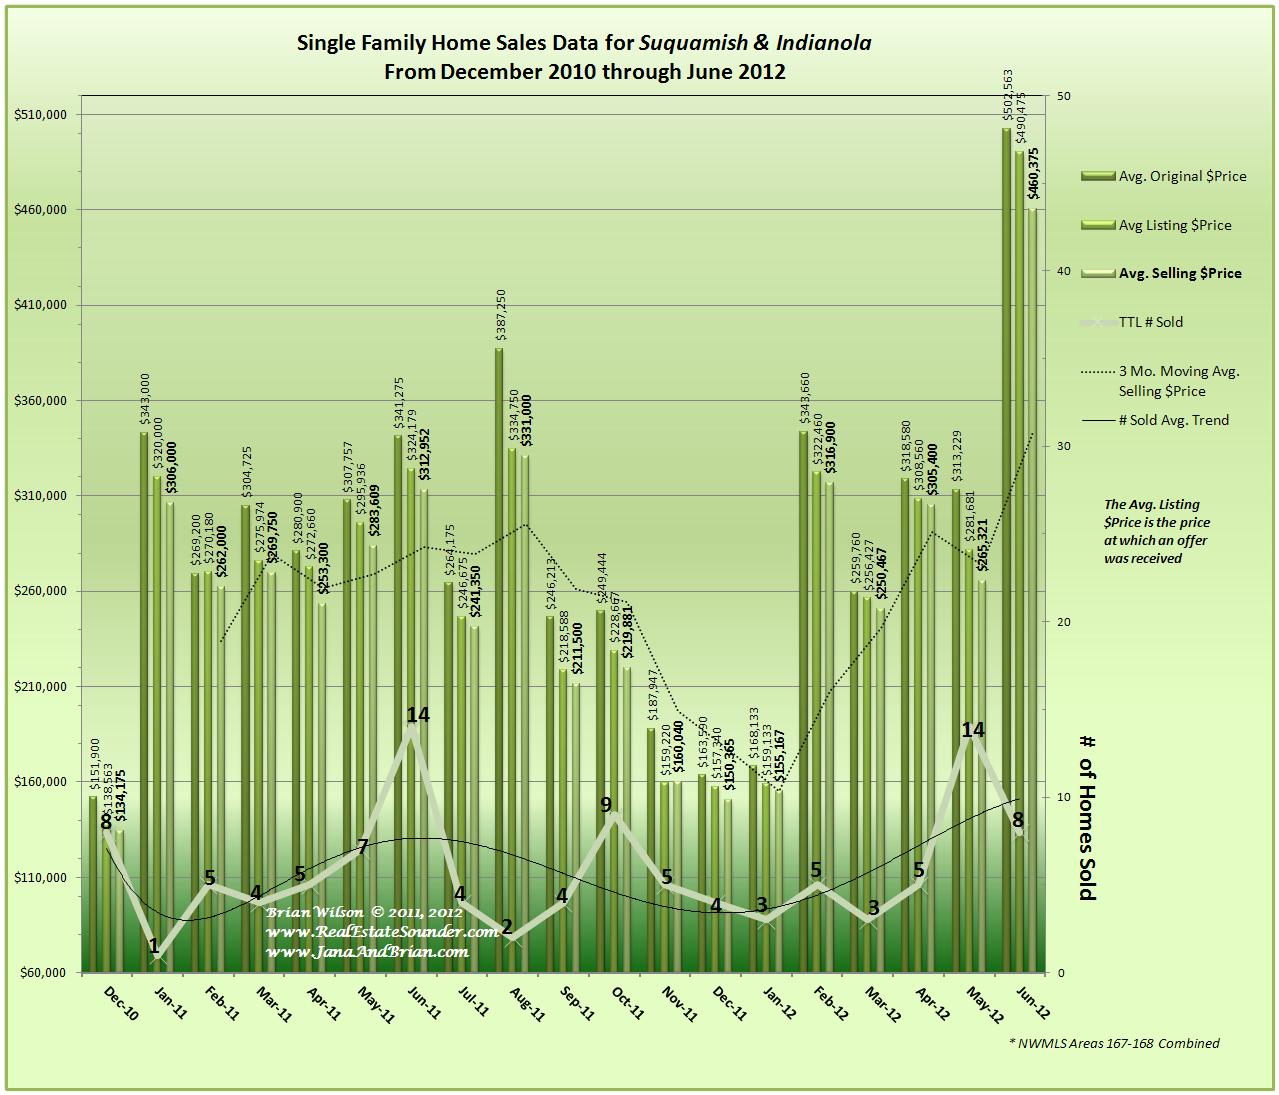
Compared with Poulsbo & Bainbridge Island, home sales in Suquamish & Indianola remain burdened with relatively high levels of distressed homes (Bank Owned REO’s & Short Sales) which have continued to cause radical gyrations in the average & median selling prices. With relatively low numbers of monthly sales in these areas, if there are one or two high priced home sales, those will also dramatically skew the data, which we also see in June with a sale in Suquamish that was in excess of $1million.
In May, there were 14 homes Sold in the area, with 4 being distressed sales, equating to a relatively normal level of 29% of total sales being distressed.
Here’s the specific data for May:
| Avg for All= | $313,229 | $281,681 | $265,321 | |
| Avg for Suquamish= | $294,659 | $259,053 | $240,864 | |
| Avg for Indianola= | $381,317 | $364,650 | $355,000 | |
| Median Selling Price for All= | $184,750 | |||
| Median Selling Price For Suquamish= | $160,000 | |||
| Median Selling Price for Indianola= | $355,000 | |||
In June there were only 8 homes sold in the area and 50% were distressed sales!
Here’s the specific data for June:
| Avg All= | $502,563 | $490,475 | $460,375 | |
| Avg Suquamish= | $517,629 | $503,414 | $470,643 | |
| Avg Indianola= | $397,100 | $399,900 | $388,500 | |
| Median All= | $374,250 | |||
| Median Suquamish= | $413,500 | |||
| Median Indianola= | $388,500 | |||
Thank you for visiting our blog. If you have any questions please contact us. We also invite your comments below.
–Brian Wilson, Broker
John L. Scott Real Estate
19723 10th Ave NE; Suite 200
Poulsbo, WA 98370
![]()

Speak Your Mind