
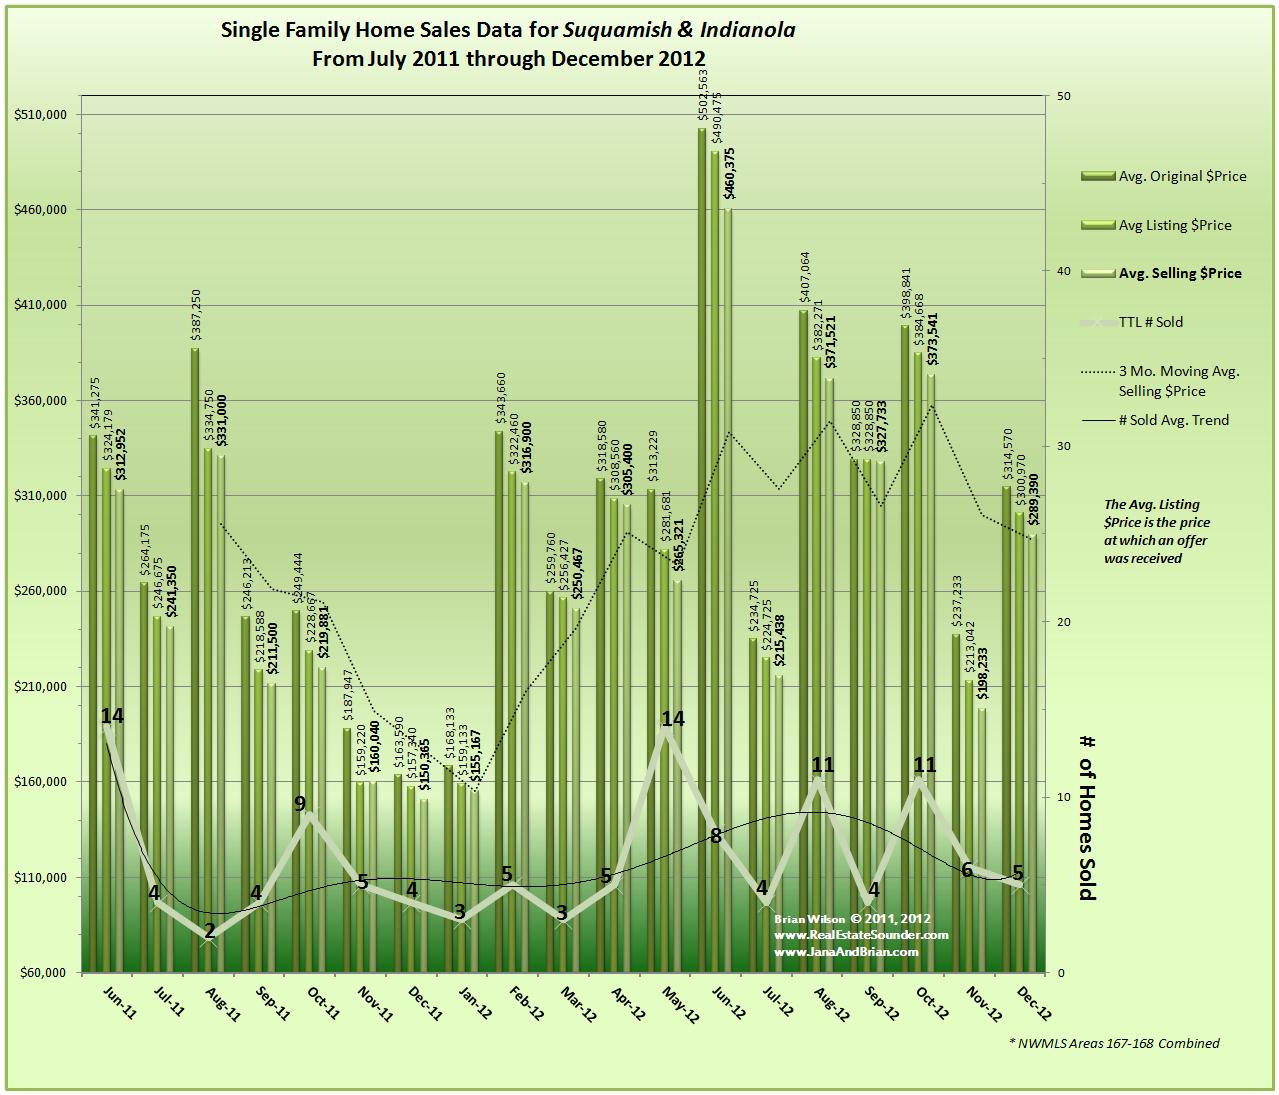
Graph of Sales, Prices & Trends for Indianola & Suquamish December 2012
The slower Winter Real Estate season continues in these areas as the number of homes sold dropped from 6 to 5 in the areas of Indianola & Suquamish. Yet, there was a significant increase in the average selling price compared to both the previous month and the same period last year.
Currently there are 36 homes listed in the NWMLS in these areas, so with only 5 homes Sold in December, this would equate to about a 7 month supply which statistically is a slow market. However; a closer look at the data reveals some interesting facts. Half of the homes currently available for sale are priced above $300,000. With nearly 70% of the homes Sold in Kitsap being priced below $300,000., This means that for the active portion of the market, there really is only about a 3 month inventory, which is a strong seller biased market.
In summary, this area is currently a tale of three markets, the High End above $500,000 which is currently slow, the lowest end which is also slow and the properties priced just right which are moving quickly.
The average selling price of homes sold in Indianola & Suquamish during the month of December was $289,390, with a median selling price of $179,950. Compared with the previous month (November 2012 ) The Average was up by about $100,000 while the Median was lower by about $60,000! With such a few number of homes sold comprising the data, one high priced home sale greatly affects these data.
The interesting thing about this area is that there are price points and properties to attract just about any Buyer. This is good for sellers, as the area attracts a diversity of buyers.
40% of home sales this month (2 homes) were distressed properties, specifically REO’s. This is expected during the slow months, as banks continue to introduce these homes onto the market at a regular frequency and a relatively consistent quantity month over month. In months where there are fewer total sales, these distressed properties comprise a larger percentage of total sales, so in these months, these types of sales have a larger impact on the prices and the market.
Thank You for visiting our Blog. Subscribe to our RSS feed for up-to-date information as we publish it!
By Briana Wilson
Reviewed by Brian Wilson, Broker
![]()
19723 10th Ave NE; Suite 200
Poulsbo, WA 98370

Speak Your Mind