
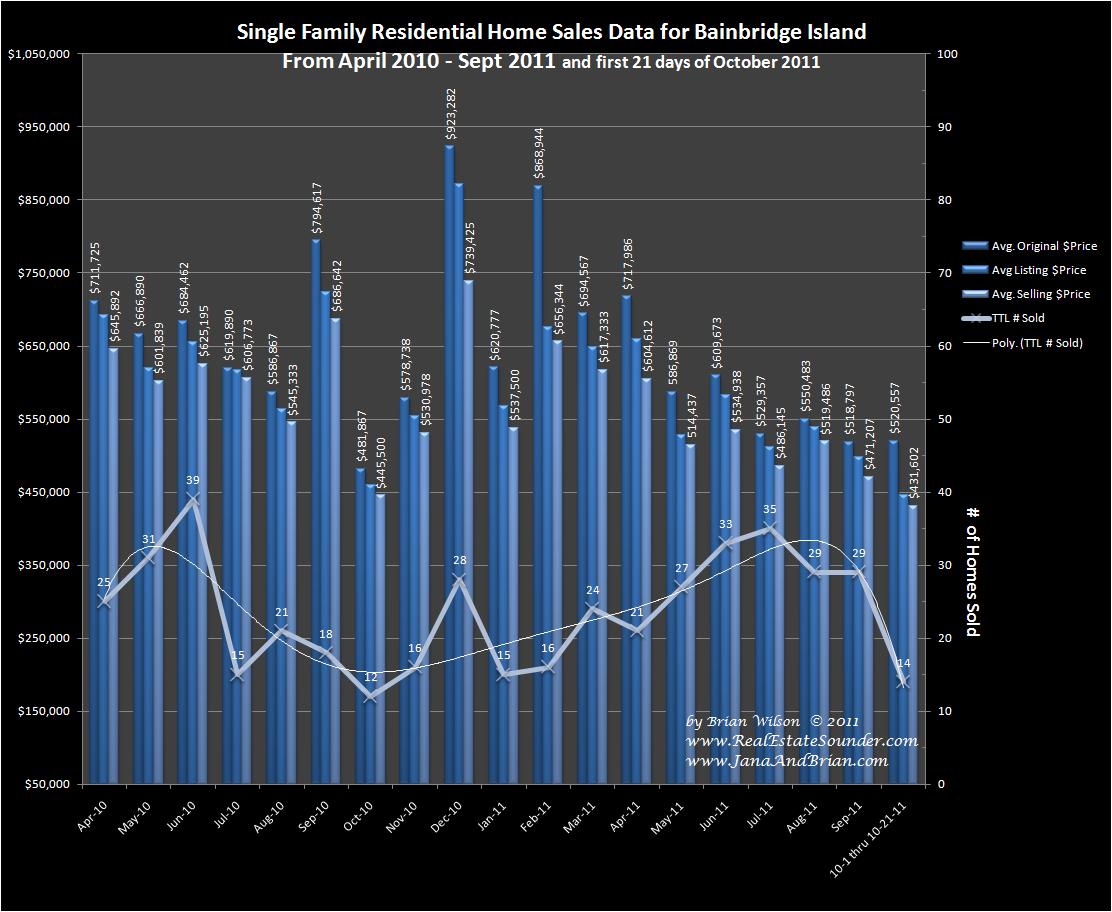
Residential Home Sales & Prices on Bainbridge Island from April 2010 through Oct 21, 2011
This graph shows 18 months of single-family residential home sales data for Bainbridge Island between April 2010 – Sept 2011 & also includes the first 21 days of Oct. 2011.
(For the most recent data, go here )
The Bainbridge Island market has a lower percentage of sales that are distressed properties compared to the rest of Kitsap County. Data for Kitsap County as a whole, shows about 32% of all Sales are distressed (REO or Short Sales). On Bainbridge Island, for the three months of July, Aug & Sept 2011, an average of only 13% of all Sales were distressed. That is more than 50% lower than the distressed sales in Kitsap County as a Whole.
Reviewing selling prices, Bainbridge Island is experiencing a Seasonal decline in the average home selling price, which is similar to the decline in the rest of Kitsap County, but a bit less. Comparing the Oct 2010 average selling price with the MTD Oct 2011 average selling price, we see that prices on Bainbridge Island are about 3% below levels of a year ago, while prices in Kitsap County as a whole are about 5% below their year ago levels. Note 1: Due to a relatively small number of home sales on Bainbridge MTD through Oct 21, 2011 (only 14), the data averages may change significantly by the end of the month, so check back here sometime around the first week of November to get the final October data, or subscribe to the RSS feed to get new data as soon as it’s available. Note 2: The “Listing Price” on the graph, is the price at which an offer was received.
Data Source: NWMLS
-Brian Wilson, Broker
John L. Scott – Poulsbo

Speak Your Mind