
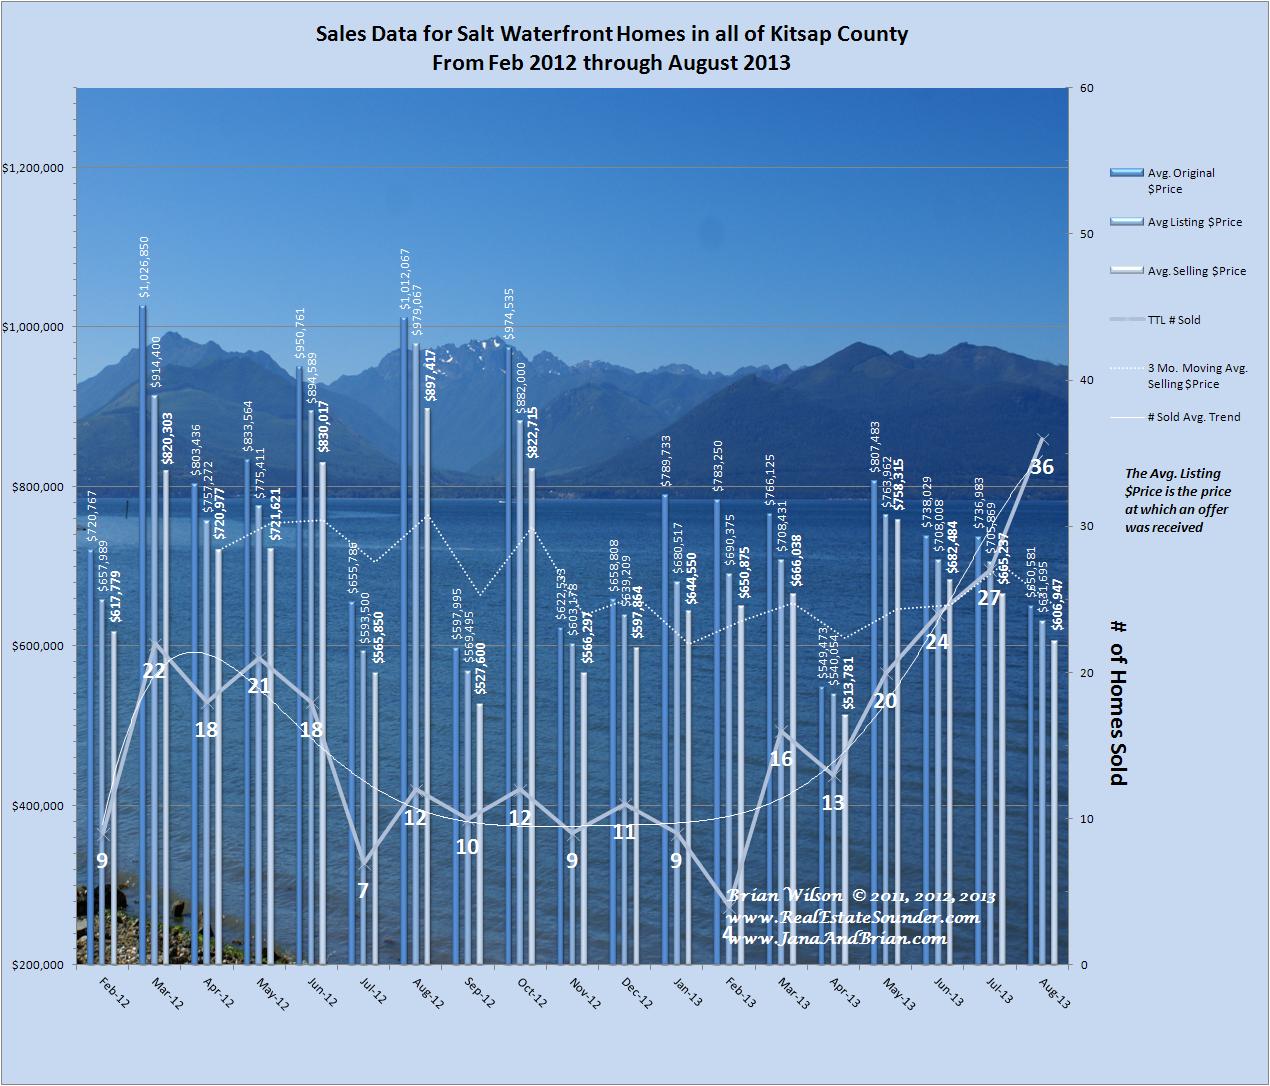
Graph 1 – Salt Waterfront Home Sales Data for the Period February 2012 – August 2013 in Kitsap County
In my previous Salt Waterfront home sales report on May 22, 2013, I discussed the brisk and increasing sales in this market segment and projected estimates of increasing numbers of sold properties. In Fact May, June, July and August each saw increased monthly closed sales month over month.
I also projected increasing Median Selling prices, estimating that May would see the median selling price increase to $670,000 and June would decline a bit to $597,450. Actual results were $495,000 in May, but June at $657,475 was in the Ball Park of my projection for May and then July also came in with a strong Median selling price at $625,000.
It appears the Pending Sales that I projected would close for each month all took a bit longer to close than projected, so May was delayed, and then June saw more of the closings that were projected for May and July saw continued strength.
Sales in August were at a peak in terms of the number of homes sold, but the median price retracted back to about the May level as the sales activity continued to broaden across all types of Waterfront homes from fixers to exquisite estates.
There were 300% more homes Sold in August 2013 compared with August 2012, however; prices were much higher in August one year ago, so at that time the market was highly selective and predominately only special higher end properties were selling, while in August 2013 the market broadened out a lot and waterfront properties of all types were selling well. See the table below for a quick comparison of monthly data.

Table 1 – August 2013 Salt Waterfront Home Sales Data in Kitsap County Compared
Here’s a Graph for Salt Waterfront Properties, comparing the total number of Homes Sold to the number of Distressed Homes Sold for August 2013 and looking back 18 months:

Graph 2 – Salt Waterfront Properties: Distressed vs Non Distressed Monthly Home Sales
As you can see, this market segment continues to have low numbers of distressed properties (REO’s & Short Sales)
Table 2 below is snapshot showing the Current Active, Pending and Month-to-Date Sold homes as of Sept 20, 2013

Table 2 – Current Salt Waterfront Market Activity in Kitsap as of Sept 20, 2013
It appears we are seeing a normal seasonal slowdown in Waterfront Property Sales but it looks like they are heading to a level that will be about twice the number of sales compared with the same period one year ago.
Presently there is a fantastic selection of fabulous waterfront properties on the market to satisfy just about any desire or dream and while the market has definitely rebounded in terms of the number of properties being Sold, for now, prices have remained constrained.
If you are Buyer and you’ve been dreaming of owning a fabulous Waterfront property, it looks to us like there has never been a better time in terms of prices, low interest rates and selection. In the last 3 weeks I’ve personally shown over 100 Salt Waterfront properties from Olympia to Camano Island to a variety of clients, mostly out of area buyers who are looking for a special waterfront retirement property, and I have never seen such fabulous opportunities in every area.
We know the Salt Waterfront market very well and we can help you achieve your needs and desires whether you are looking to buy or sell anything form a rural cabin to a fabulous urban estate, so don’t hesitate to introduce yourself, we’d love to talk with you!
Thank You for visiting our blog. We hope you will bookmark it in your browser and come back often, or we invite you to ![]() Get the RSS feed
Get the RSS feed
Brian Wilson, Broker; mobile: 360-689-2466
-and-
Jana Salmans, Managing Broker; mobile: 360-509-9684
John L. Scott Real Estate
19723 10th Ave NE; Suite 200
Poulsbo, WA 98370
![]()

Speak Your Mind