
Bainbridge Island Residential Home Sales Data
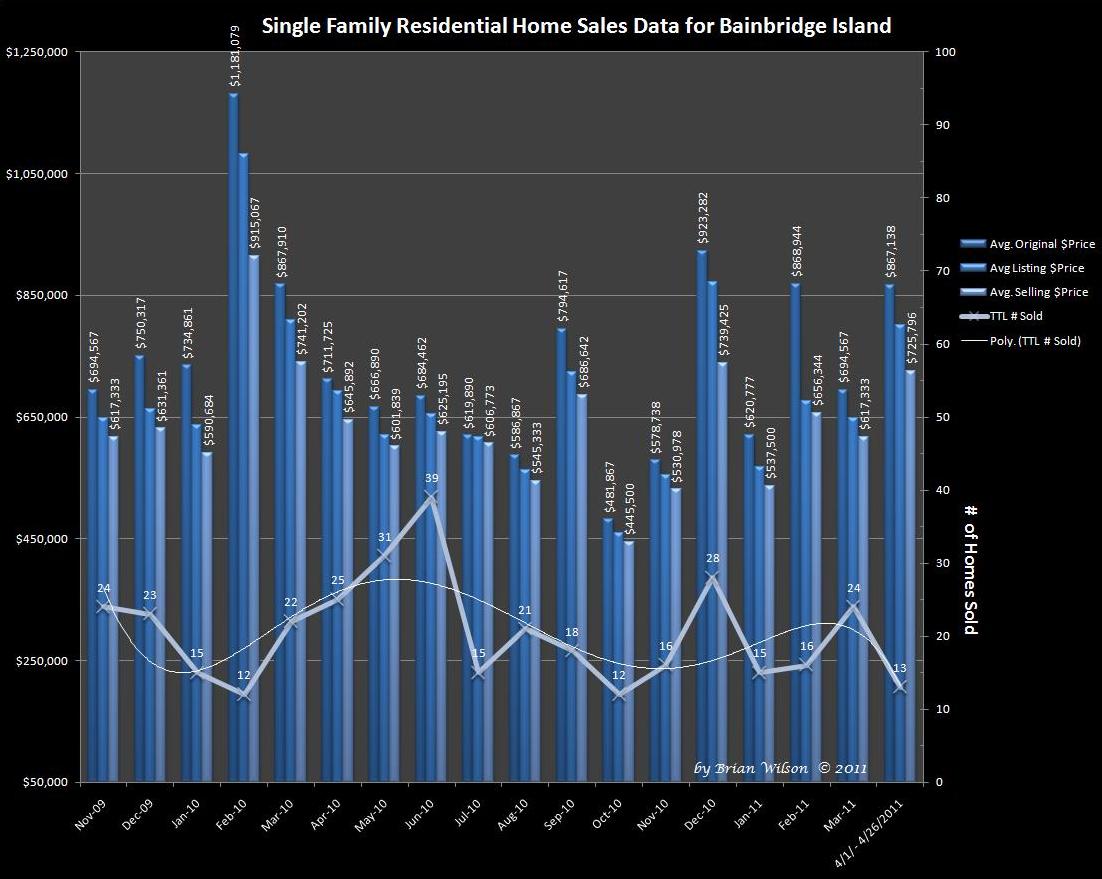
This graph shows the previous 18 Months Sales Data for ALL Single Family Residential Home Sales on Bainbridge Island, WA. It is not quite all the way through the Month of April, but I don’t expect to see more than about 4 -5 additional closings through the end of the month, however; the month of May appears setup to be a relatively good one when considering the number of properties currently in a “Pending” status that will likely close in the Month of May.
The number of homes sold on the Island, has varied significantly month to month and over time, but overall it appears to have trended a bit more level, after the major decline of 2007-2008, than Kitsap County as a whole. This is not to say that Sales on the Island have not experienced a decline in terms of prices or numbers, they absolutely have. They just haven’t swung as high, likely due to less effect from the various first time home buyer tax credits which at key points buoyed sales in other parts of Kitsap where median prices were much lower.
The data on the Island which is relatively the same as the rest of the County over the previous 18 months: The Original Asking Price, compared to the Price at which an offer was received and then finally the Actual Selling Price. The 3 bar graphs show these average prices month-over-month and my conclusions are the same as for the graph I posted showing this same data for the entire County.

Speak Your Mind