
Poulsbo Home Sales & Prices Feb2012 & 18 Mo Prior
This is our first monthly posting which tracks Real Estate sales, prices & trends for residential home sales in Poulsbo. Poulsbo broadly includes a much larger and irregularly shaped geographic area extending far beyond the actual incorporated city limits. For our purposes in tracking the logical area real estate sales, we have included NWMLS areas 164-166 and further limited to the zip code 98370. This area roughly encompasses both sides of the North end of Liberty Bay, Just before Keyport to the South, Hood Canal to the West, Lofall and Hood Canal Bridge to the North, and Miller Bay Rd. to the East. We include the communities of Lakeness,Vinland, Woods & Meadows, Breidablik, Edgewater Estates, Big Valley, North Clear Creek, Sherman Hill, Scandia, Pearson Point, Virginia Point, Downtown Poulsbo including Poulsbo Place, Fjelview, Ridgewood, Kevos Pond, Alasund Meadows, Deer Run, Gala Pines, Havn Heights, Meredith Heights, Forest Rock, Poulsbo Gardens, Applewood Estates, Austurbruin, Baywatch, Indian Hills Estates, Lemolo, and the new developments of Chateau Ridge, Snowberry Bungalows, Caldart Heights, Liberty Ridge, & Avondale Glen.
For the purposes of this data, we decided not to include Miller Bay Estates as it is actually in area 168 which is closer to Indianola.
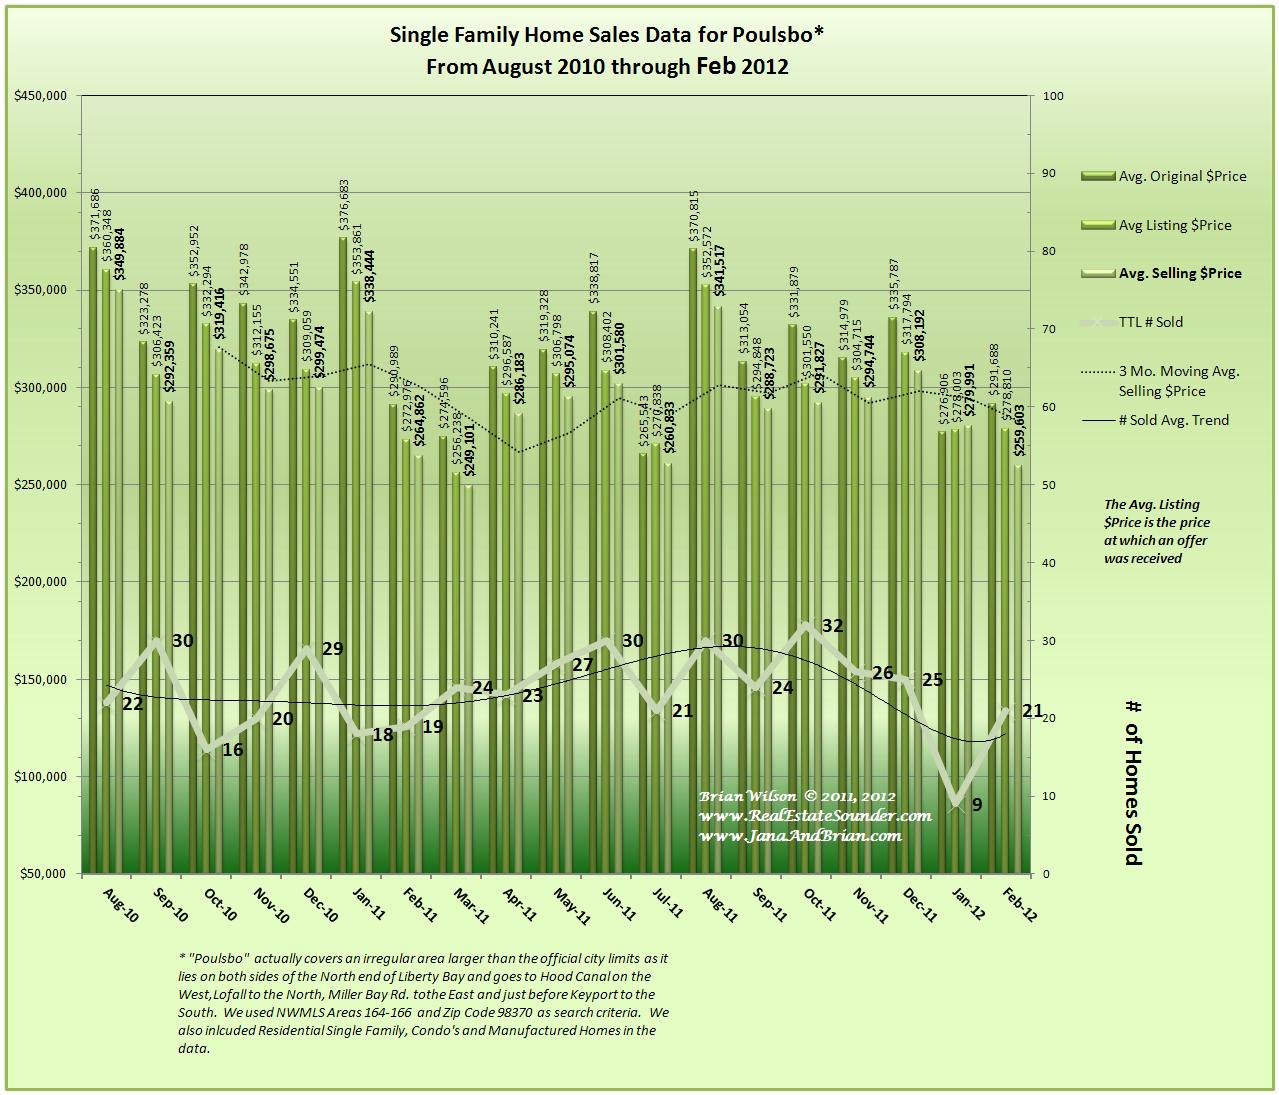
This graph shows the average original asking price, the average listing price at which an offer was received and the average selling price. The dotted trend line is a 3 month (quarterly) moving average for the average selling price of homes in Poulsbo.
This information provides an indicator of the relative market strength and the relative difference between where Buyers and Sellers are initially valuing the average home. As the market strengthens and inventory drops, the average selling prices increase and there are also some times where the average selling price exceeds the average listing price or even the average initial asking price. In these cases, it can be caused by buyers bidding up prices (multiple offer situations) or more typically, if there are a significant number of Short Sale listings on the market, the initial asking prices prices may be much lower than where a lender is willing to accept the sale and buyers are in fact willing to bid the price up above the average initial asking prices.
The lower trend line shows the trending average number of homes sold.
There are some very interesting results showing in this data:
- The monthly number of homes Sold has been amazingly consistent and in a very tight range between about 18 to 30.
- The average selling price has also been in a relatively consistent range for about the last 6 months, however; last month (February) saw a decline that was relatively close to the data for February 2011 one year ago. Other than the very low number of homes sold in January, it appears that the market is relatively stable and is following some sort of normalized sales and pricing data with typical seasonal influences.
If you are interested in the distressed real estate market in Poulsbo, watch for our posting which will have information about the distressed, REO (Bank Owned) and Short Sales data in the Poulsbo area.
Thank You for visting our blog and we hope you found it useful or at least interesting. If you have any questions or suggestions, please let us know.
–Brian Wilson, Broker
John L. Scott Real Estate
19723 10th Ave NE; Suite 200
Poulsbo, WA 98370
![]()

Speak Your Mind