
Bainbridge Island Home Sales and Prices Chart
(If you want the most recent data, go here )
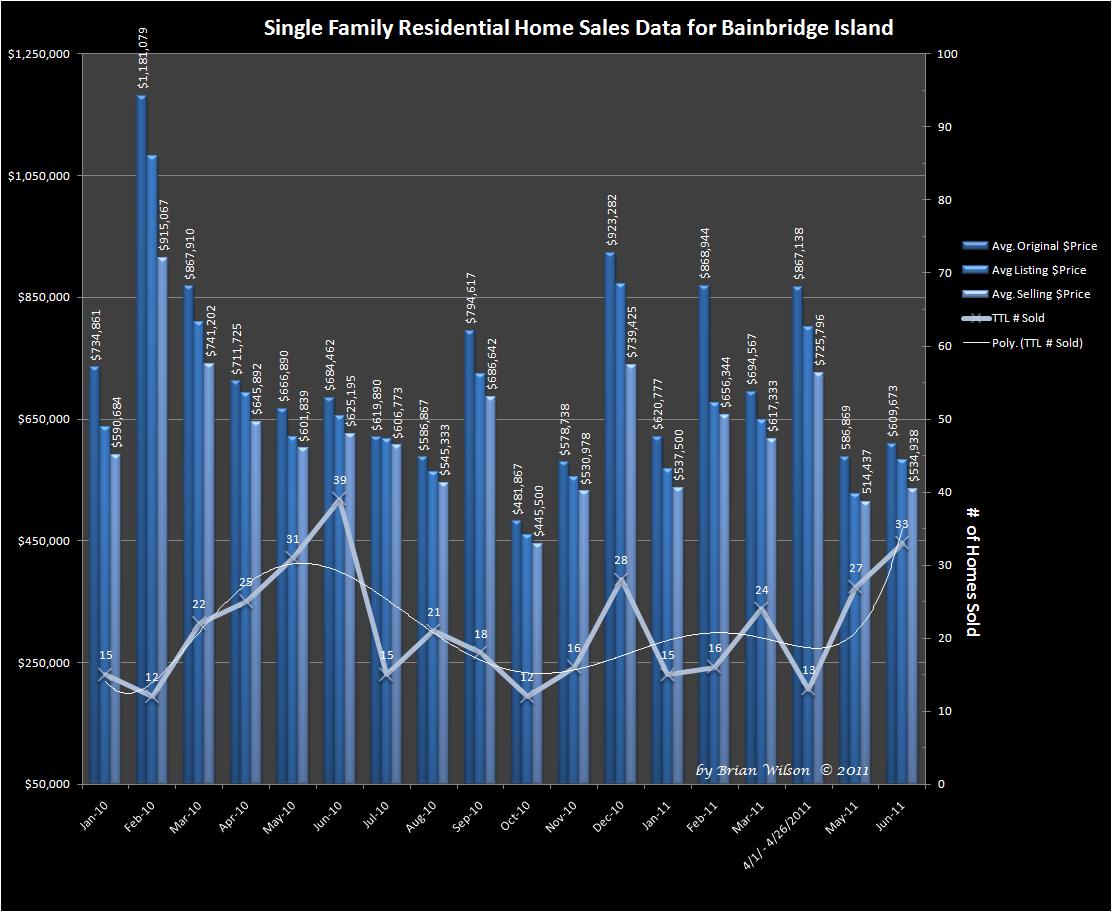
The chart above shows 18 Months running of Home Sales and Prices on Bainbridge Island, through June 30, 2011. For each month, for all of the Sold Homes, you can see the Average initial asking price, the Average listing price at which an offer was received, and then the Average “Sold” price.
The Bainbridge Island Market continues to have a slightly lower percentage of “distressed” properties on the market compared with the rest of Kitsap County. While the average percentage of Distressed Sales in Kitsap County have been between 33 – 39% of all Sales, on Bainbridge Island in May, just 6 out of the 27 Sold (22%), were distressed (Bank Owned or Short Sales). In June 6 out of 33 Sold (18%) were distressed Sales.
As of June 30, there were 43 homes in some sort of “Pending” status so it appears Sales are continuing their seasonal rising trend and appear headed for the largest monthly sales volume we’ve seen on the island since more than two years ago!
While increasing numbers of home sales is great, prices on the island remain under pressure as the number of homes on the market are also pushing a two-year high, so supply is still way outpacing demand and Buyers are continuing to be extremely selective.
-Brian Wilson, Broker
John L. Scott – Poulsbo
John L. Scott – Poulsbo

Speak Your Mind