
Poulsbo Home Sales, Prices & Trends for August 2012 & 18 Mo Prior
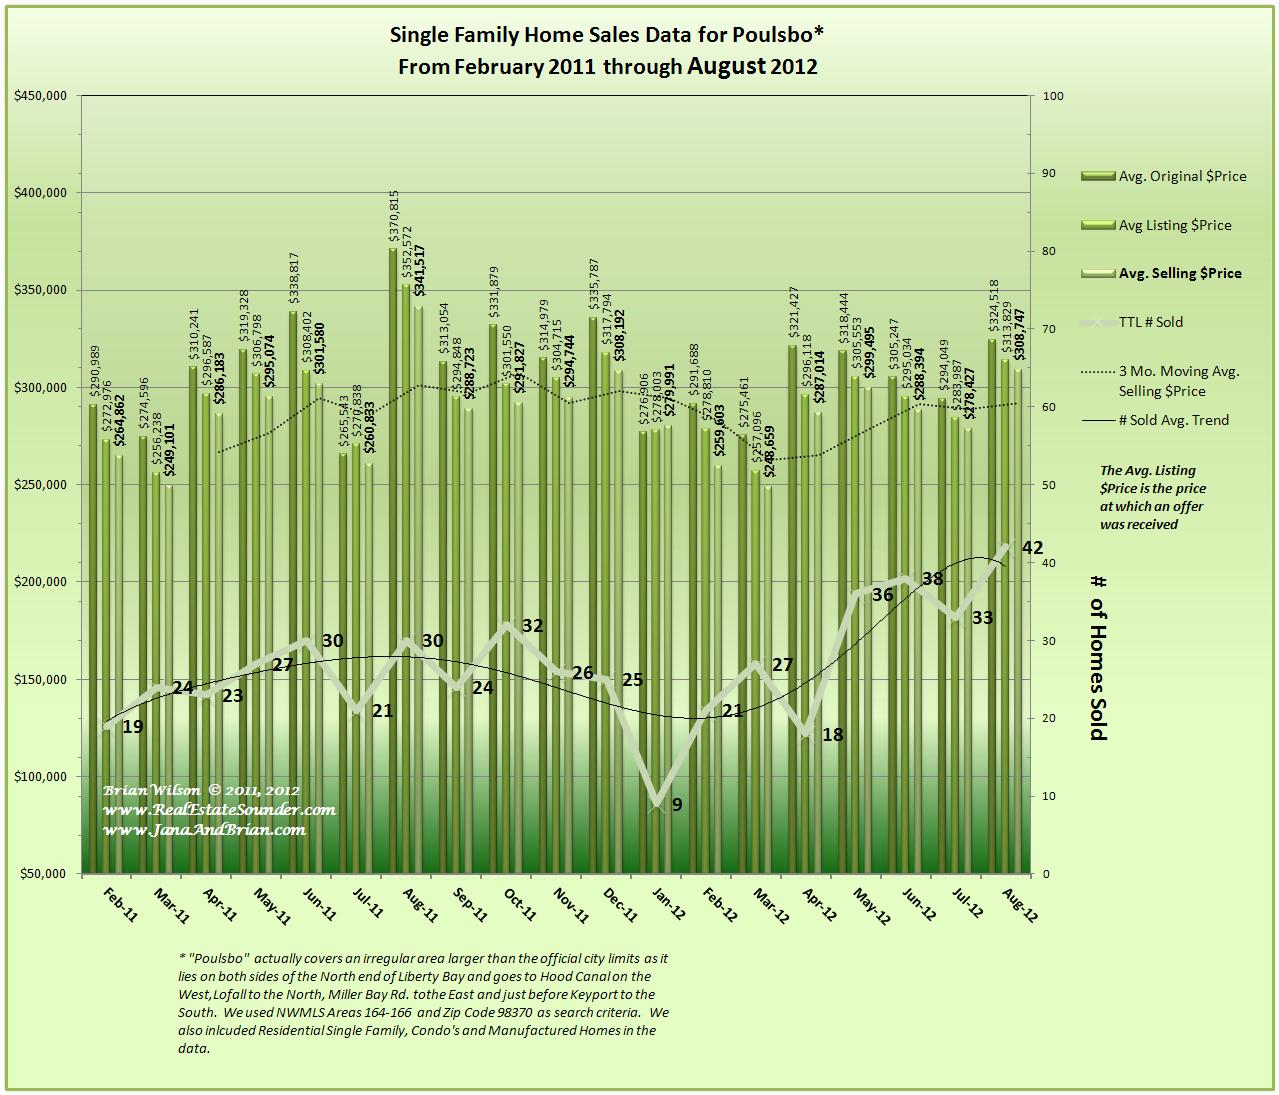
The number of homes sold in Poulsbo for the month of August 2012 was the highest it’s been in more than 2 years, echoing similar data for the County as a whole and also for the Bainbridge Island market. Prices are at their highest level in the last quarter and distressed homes comprised about 19% of the total number of homes sold for the month, a percentage similar to the County data as a whole.
This month, my discussion for the Kitsap County home sales data is very nearly the same discussion I have for the Poulsbo market, so here’s a link: http://wp.me/p1lMbw-gv if you are interested in reading the factors driving and influencing the Real Estate market in Kitsap County and Poulsbo. The graph shows the actual Poulsbo data, and includes: the average initial asking price, the average price at which an offer was received and the average selling price along with the trends and median selling price.
Thank You for visiting our blog. Be sure to subscribe to the RSS Feed if you’d like to get automatic updates whenever something is posted here.
Brian Wilson, Broker
![]()
John L. Scott Real Estate
19723 10th Ave NE; suite 200
Poulsbo, WA 98370

Speak Your Mind