
Average Selling Price Skyrockets for September. Number of Homes Sold Hits 4 year High in October. November Home Sales see seasonal decline.
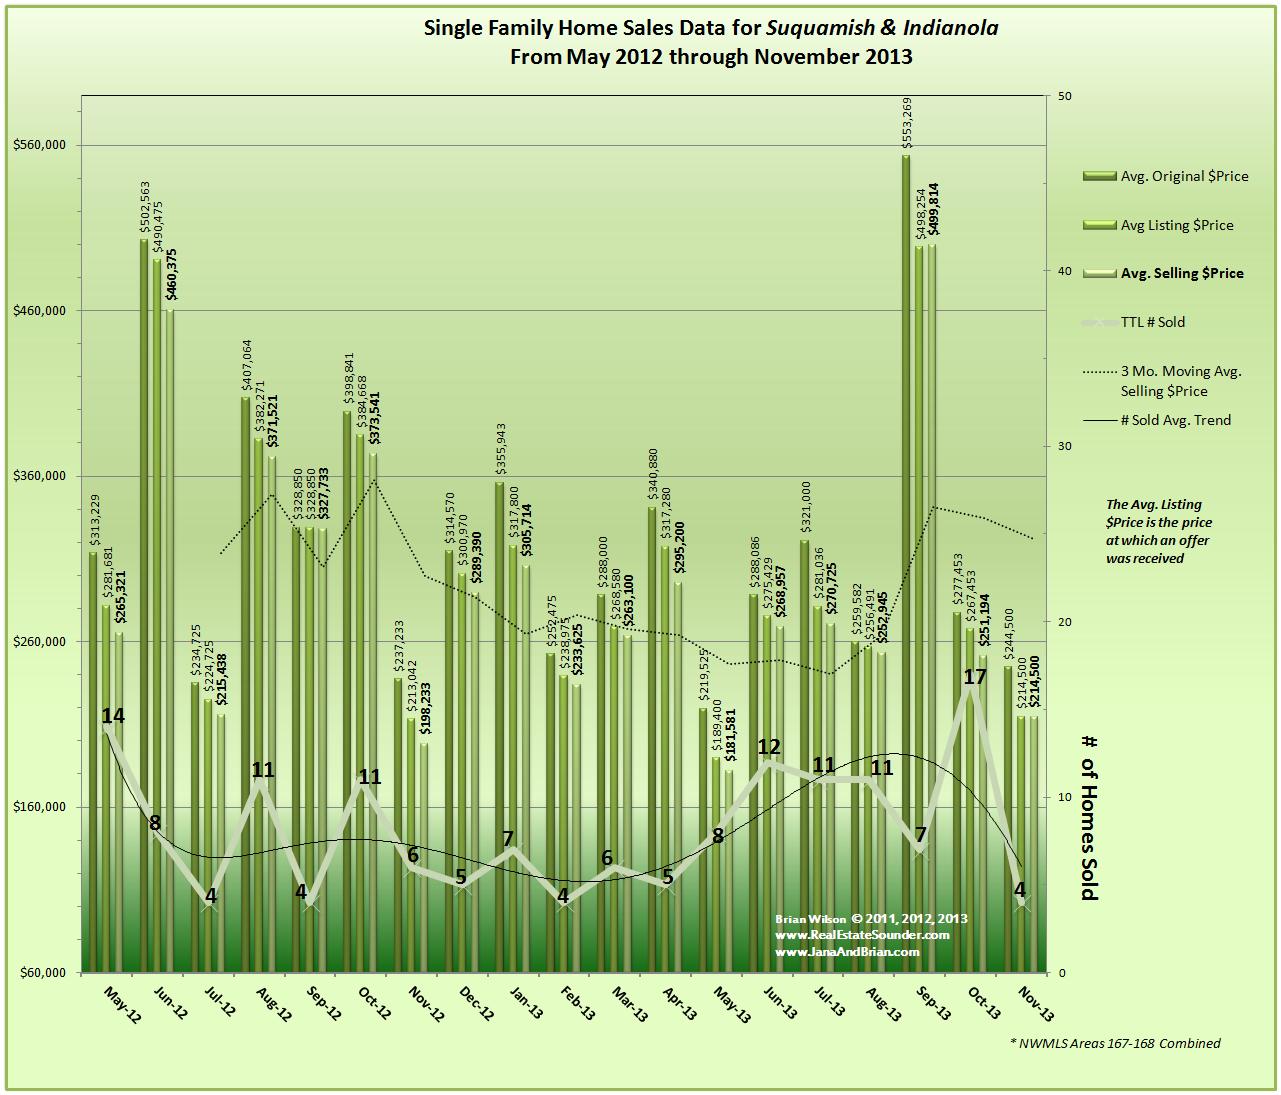
Indianola & Suquamish have followed the expected seasonal trend of decreased home sales in November, and also reached a low average selling price for the year. But take a look at that average selling price in September! When we move to October, the number homes sold spiked to 17 for the month, which is a high for more than 18 months in this area. The relatively low number of monthly home sales is a significant factor in large monthly price swings, but this certainly is a huge swing.
The average original price for homes placed on the market during September was $553,269, with an average selling price of $499,814. This is over a 50% increase in the price of homes sold compared to October Sales and over 34% above the level from Septemeber one year ago.
October was an outstanding month in terms of the number of homes sold in Indianola & Suquamish area. Not only do we see the most homes sold in more than 18 months, but there were 55% more Sold compared with October 2012, however; average sold prices were 48% lower than during October one year ago. So, more homes were sold at lower prices compared with October a year ago.
The average days homes were listed on the market before the sale finalized during September was 113, which is much different than the average DOM of 31 days we saw in August, but not unexpected for higher priced home sales and the typical seasonal slow down as we enter the winter season. October’s average DOM dropped to 79, while time on market again extended during November to an average of 145 DOM.
Thank You for visiting our Blog & Please feel free to contact us with any questions! Don’t forget to subscribe to the RSS Feed to automatically stay updated with our posts
| September 2013 | October 2013 | November 2013 | |
| Avg. Original $ | $553,269 | $277,453 | $244,500 |
| Avg. Listing $ | $498,254 | $267,453 | $214,500 |
| Avg. Selling $ | $499,814 | $251,194 | $214,500 |
| Median Selling $ | $499,900 | $200,000 | $214,500 |
| $/sq ft | $164 | $137 | $145 |
| TTL # sold | 7 | 17 | 4 |
| DOM | 113 | 79 | 145 |
| CDOM | 113 | 79 | 145 |
| TTL # Distressed/% | 2/29% | 4/24% | 1/25% |
| SS | 1 | 3 | 1 |
| REO | 1 | 1 | 0 |
Table 1
Brian Wilson, Broker; mobile: 360-689-2466
-and-
Jana Salmans, Managing Broker; mobile: 360-509-9684
John L. Scott Real Estate
19723 10th Ave NE; Suite 200
Poulsbo, WA 98370
![]()
Data Source: Northwest MLS (NWMLS)
The NWMLS, Brian Wilson or Jana Salmans do not guarantee the accuracy of this data and are not responsible for it’s accuracy. Data from the NWMLS may not reflect all real estate activities in the market. Information deemed reliable but not guaranteed.

Speak Your Mind