
A Record Number of Homes Sold on Bainbridge Island, exceeding a 5 year high in July and matching the 5 yr. high in June.
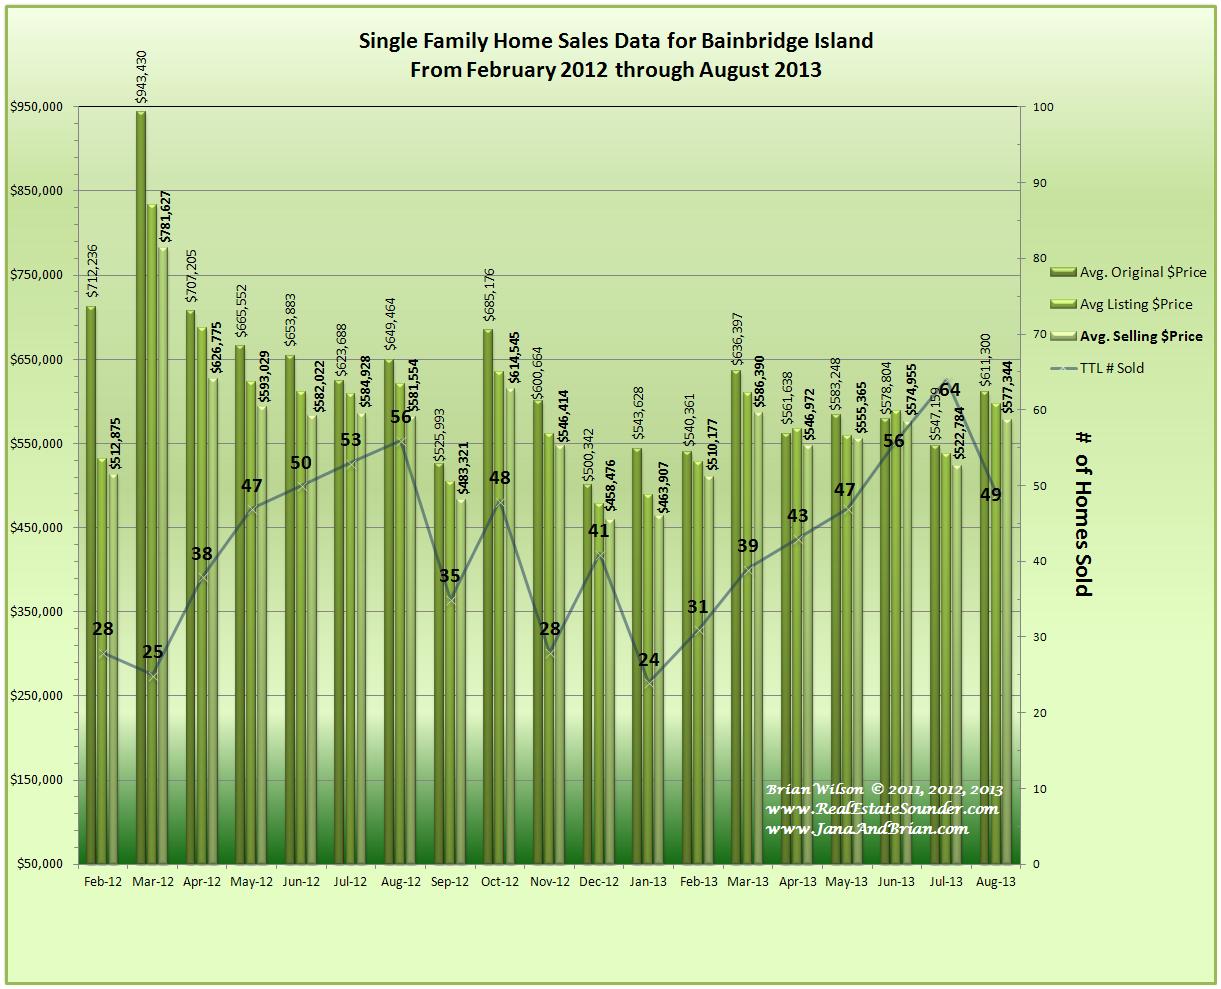
August 2013 & Previous 18 months of Home Sales Data for Bainbridge Island
As we predicted in early June, “ Looking ahead, it appears the Real Estate market on Bainbridge Island is continuing an increasing price and sales trend.“
The number of homes Sold on Bainbridge Island were very strong in June, peaked in July and then slightly pulled back in August, but remained within the normal expected seasonally high range.
In early June, our analysis of the mix of Pending Sales indicated Average prices would slightly decline in June and then rebound strongly in July and beyond, however; the actual closed sales were a bit out of synch from our projections, so Average Sold Prices in June were a bit higher than in July, but then August prices rebounded even higher than June levels. So, we correctly predicted the trend, but our estimate of the actual individual homes that would close in each month varied a bit from the actual results.
Below is a five year graph that shows the number of monthly Active, Pending and Sold homes on Bainbridge Island. As you can see, the inventory of available homes for sale (light green) has been at the low end of the 5 year range, while the number of Sold homes (dark green) has been at or exceeding the 5 year high. This is a general scenario in which the time on market decreases, absorption rate increases, months of supply decreases and all of this points to increasing prices. Though we expect to see a typical seasonal decline in monthly home sales in the coming Winter months, we will be watching closely and providing our insights.

5 yr graph of monthly Active, Pending & Sold homes on Bainbridge Island
The Median price for Sold homes, shows the same trend as the Average prices, with a slight dip from June to July while rebounding strongly in August. In fact, the Median selling price for a home on Bainbridge Island in August 2013 was at it’s highest point in 12 months and 6.6% above the August 2012 level.

Table 1 – Comparing August 2013 Home Sales data on Bainbridge Island
In table 1 above, we have also included a new quantitative metric; the difference between the last average asking price at which offers were accepted and the final Average Sold price. In other words, looking at the August 2013 data, the Average final Selling price was 3.21% below the last asking price, which was also lower than the Average initial asking price by 2.42%.
So, using the August 2013 data as an example, on average, the price where willing Buyers and Willing Sellers came to terms, was 5.63% below the average initial asking price. We’ve been showing this data in our monthly graph with the 3 vertical bars since publishing this blog. For any given month, the left bar is the average initial asking price, the middle bar is the average asking price when an offer was accepted and the right bar is the average selling price. This allows you to quickly see on average how strong prices are holding compared to the average initial asking prices.
We decided to include the numerical values here as we believe it is a good relative indicator of market heat and psyche and is helpful to both Sellers and Buyers to provide reasonable average expectations. Looking at the August 2013 Data, a buyer is not likely going to be successful coming in with an offer that is more than 5.63% low, and Sellers need to expect some amount of price concession form their initial asking prices… individual properties may vary, but on average this is where prices settled in the market between willing buyers and willing sellers.
We generally interpret this data in the following way: From the seller view, a smaller negative number means sellers on average did not feel compelled to discount their last asking price as much because of confidence in getting another buyer if the current offer were to fail, or alternately with a larger differential, sellers have made more price concessions and may be feeling more financial stress and uncertainty about the market with fears of declining prices.
Conversely, on the buyer side a lower negative (or in some cases positive) differential means buyers on average did not negotiate lower prices (or paid up) likely out of fear of losing a deal to another buyer, indicating increasing competition among buyers and a rising home market. Buyers may also fear rising interest rates and might therefore be compelled to pay up to get the deal done before rates rise….to a point.
We think this a good metric of how buyer centric or seller centric the market was in any given month. Of course we also see this in the prices themselves, but those can be affected by variations in the mix or composition of home price categories that are purchased in any given month, while we think the average price differential data is less affected in this way.
Here’s a look at the current market activity:
Table 2 shows the Pending, Contingent and Month-to-date home sales activity and prices on Bainbridge Island as of 9-13-13:
 | Active $68,450 Port Orchard, WA South Kitsap | Lot Size: 0.47 | MLS #: 512792 (NWMLS) |
Here’s our projection for home sales and prices on Bainbridge Island for September 2013:
It appears the number of homes that will be Sold in September is on track to nearly meet the August levels, though may fall just a bit short. In any case, it looks quite certain that home sales and prices for the month of September 2013 will be significantly above the September 2012 levels.
Analyzing the current list of Pending home sales along with the month-to-date Sold homes, it appears that the Median selling price will be rising again during the month of September to a new 13 month high, and could set a new 18 month high. The Average price also appears to be on the rise.
Thank You for visiting our blog. We hope you will bookmark it in your browser and come back often, or we invite you to ![]() Get the RSS feed
Get the RSS feed
Brian Wilson, Broker; mobile: 360-689-2466
-and-
Jana Salmans, Managing Broker; mobile: 360-509-9684
John L. Scott Real Estate
19723 10th Ave NE; Suite 200
Poulsbo, WA 98370
![]()

Speak Your Mind